You hear time and time again how 50 to 80 Percent of Data science projects is spent on data wrangling munging and transformation of raw data into something usable. For me personally. I’ve automated a lot of those steps. I built tools over the last 20 years that help me do more in less time.
Look at how quickly I was able to pull in the severe weather data inventory. While the source was 10.8 gigs of text data, I was still able to pull it in within an hour using my file Interrogator. I was even able to stage a copy in SQL server in slightly more time. For many projects, staging data like this would be the biggest cost. But for this project, it was only the beginning.
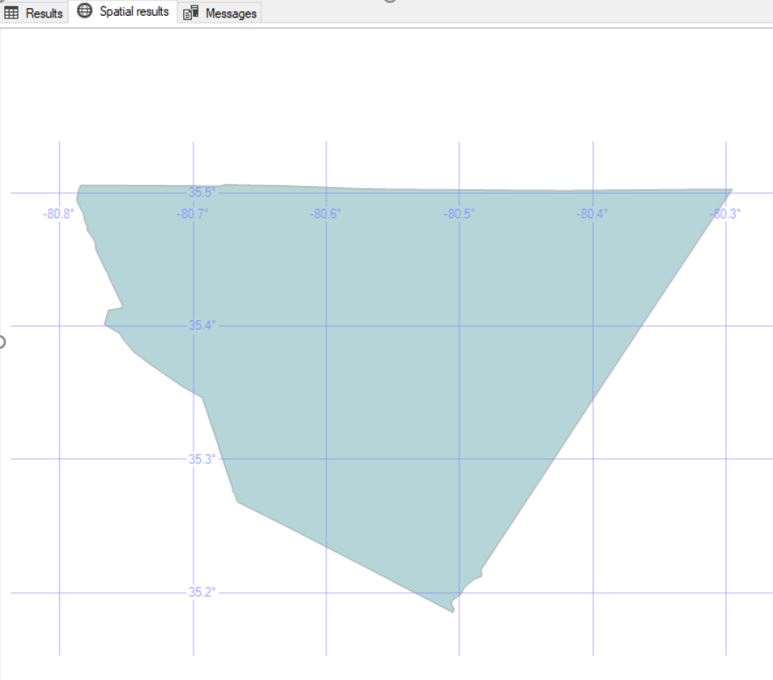
The SWDI contained latitude and longitude for all of the hail signatures. What I needed was state County Township and range. Fortunately, SQL Server has code that can do lookups like this.
DECLARE @Location GEOGRAPHY = geography::Point(35.409510, -80.573090, 4326)
SELECT StateFP, CountyFP, shape
FROM [dbo].[cb_2017_us_county_500k]
WHERE
        @location.STIntersects(shape) = 1
This code returns my county for my home coordinates.
There’s just one little problem. Each row takes nearly one second to look up the state, county, township, and range for a coordinate. No big deal, until you do the math to see that our data from 1996 until 2018 had 133,244,472 rows. After some tinkering with different ways of performing the SQL code, I realized that even with all the smarts baked in for parallelism and threading…SQL Server itself was a major part of my processing bottleneck.
Fortunately, the STIntersects function in SQL Server is actually .Net code under the hood. So I attempted to pull the geocoding process out of SQL and only use the database for storage and IO. I wrote a quick single-threaded process to read a batch of rows from SQL server, geocode them, and then write the results back to SQL Server. I was able to get my time down to about 800 ms per row. Better, but not great. We’re still talking about three years, four months 16 days to process all this data.
I relented and moved storage back to files. I took the C# code I wrote above and changed it to read and write files. I even got this code to work with parallelism. Each thread would work on a separate file. It didn’t handle errors within a file well. If it crashed, I would have to reprocess a whole file again. I ended up creating a lot of duplicates in my output file. The parallelism helped cut down processing time, but the time to check for and then resolve errors was taking more and more processing power to handle.
At one point I attempted to create ADLA scripts to geocode these rows. It turns out ADLA doesn’t work for RBAR (Row By Agonizing Row) processing. I opened a ticket with Microsoft to see if there was any way to make this work, and in the end, this kind of workload isn’t a fit for ADLA.
I went back to research mode. How were others handling high CPU cost transformations? While reading articles, some old memories came to me of SETI @ Home and Folding @ home. Distributed computing was the answer. But how could I manage the workload to minimize duplicates and make dealing with errors easier?
The answer came from Azure Queues.
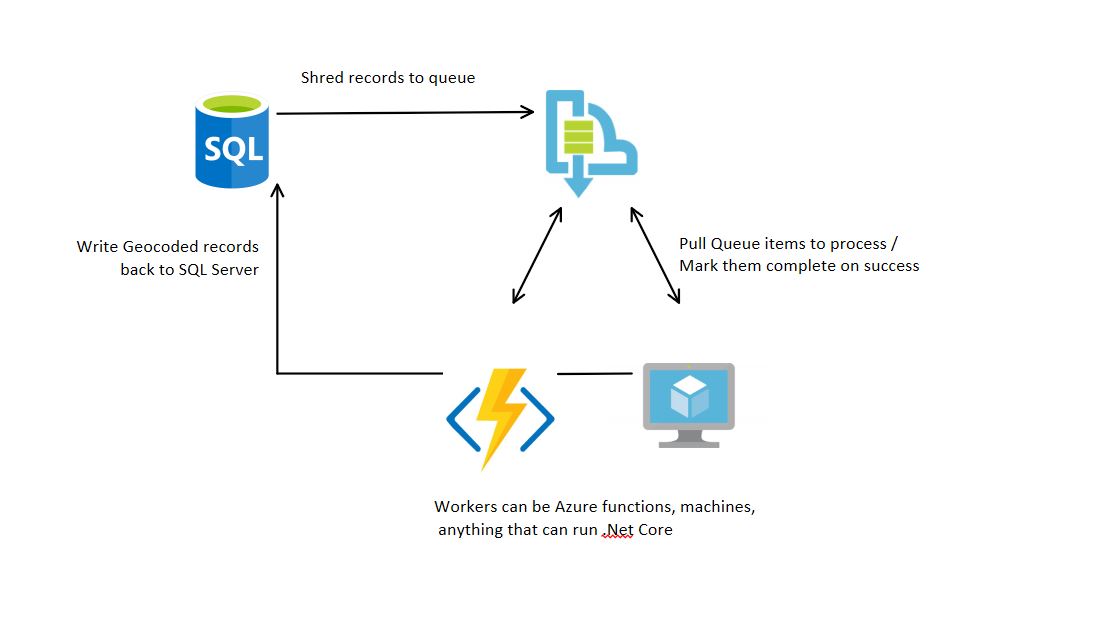
First, I take my raw row and upload it to the Queue. (Setting up my RBAR store.)
Each processing machine has a certain number of cores it can contribute to the worker pool. Each one of these cores can grab up to 32 rows at a time to process. Azure Queues allow you to define an amount of time this processing machine has to complete the work on those rows before it would allow another machine to pull those same rows from the queue.
The great thing about that is if your worker dies after the request, it doesn’t have to come back and say, I couldn’t finish. Azure manages that itself. I set the timeout pretty high. Based on my worst performing tests, I could geocode a row in 1 second, so 32 seconds was the max it should take. I went higher and gave each worker 5 minutes to try before another machine would get a chance.
To improve performance, I would have each worker download the shapes for all States, Counties, Townships, and Ranges before attempting to geocode. That way, you only download that information once and keep those shapes in memory local to each worker. The full download size was 130MB uncompressed. So each machine would need minimal memory to keep it.
To minimize duplicates, I had each worker write the results directly to a database that contained multiple tables (one for each year’s data). Each table had a constraint on the hail event date, coordinates, and other attributes. That way we would not store duplicate values. Error handling and prevention became the slowest part of the process.
After several iterations of this program, I ended up delivering it to 100 cores in Azure and ended up spending nearly $5,000 in a single month. So I started asking co-workers to leave their machines on at night and run this worker process overnight. I was able to collect more than 200 cores in my worker pool at its height and complete processing for the full workload in three months. That is approximately 58ms per row.
So, regarding data munging, this has been closer to 80 percent of the time of this project. Fortunately, it wasn’t my time; it was processing time. Regarding my time, I was only working on this project in part of my time. At this point in the project, I have less than 100 hours in the project.
With this done, I can now move on to the Data Science part of the project and take this data to Azure’s Machine Learning Workbench.
What do I want you to learn from this?
There are three legs to Data Science: Math, Programming, and Domain Knowledge. During this phase of the project, I was pushed to implement programming concepts I knew about but had never developed before. The ability to quickly move from theory to practice was key. You’re going to need to be able to do the same on your projects. I would recommend finding an open source data science project through Kaggle, GitHub or the like so you can grow your programming skills. Push yourself to learn and implement new things in code. This will prepare you for the challenge of needing to do the same thing on a production project!
Next Time
We’re going to dive into Azure Machine Learning Workbench and take this data to start finding some insights in the data. We’ll start with a simple question: “Will a farm in a given State, County, Township and Range file a hail claim in the next year?” After that, we can try something more difficult like: “How much will the hail claim be for a given county next year?”