As a SQL Server user moving into Databricks, reporting and dashboarding can be a more manageable learning task. It all begins by changing to the SQL Persona in Databricks. Click the persona icon from the upper left menu, and choose SQL.

Once in the SQL persona, you can begin querying any data your workspace has defined. You can always use the sample data available in every workspace if you don’t have any data.

Some New Terminology
Before we dive into reporting, here is a little terminology to help you. In Databricks, there is this concept of a metastore. It’s a metadata repository you use to define schema around your data. You can have one of three types of metastore. The first is the hive_metastore. It’s tied to a single workspace. The second is the Unity Catalog metastore. This one can span multiple workspaces. The third is an external metastore. Leave this for after you’re more comfortable with Databricks.
Going one level below metastore gets you catalogs. These are most closely matched to a database in SQL Server. They hold multiple schemas. Finally, schemas hold objects like external tables, managed tables, and views.
Before Unity Catalog, Databricks only supported two-part names and effectively bypassed the database concept altogether.
Writing a Query
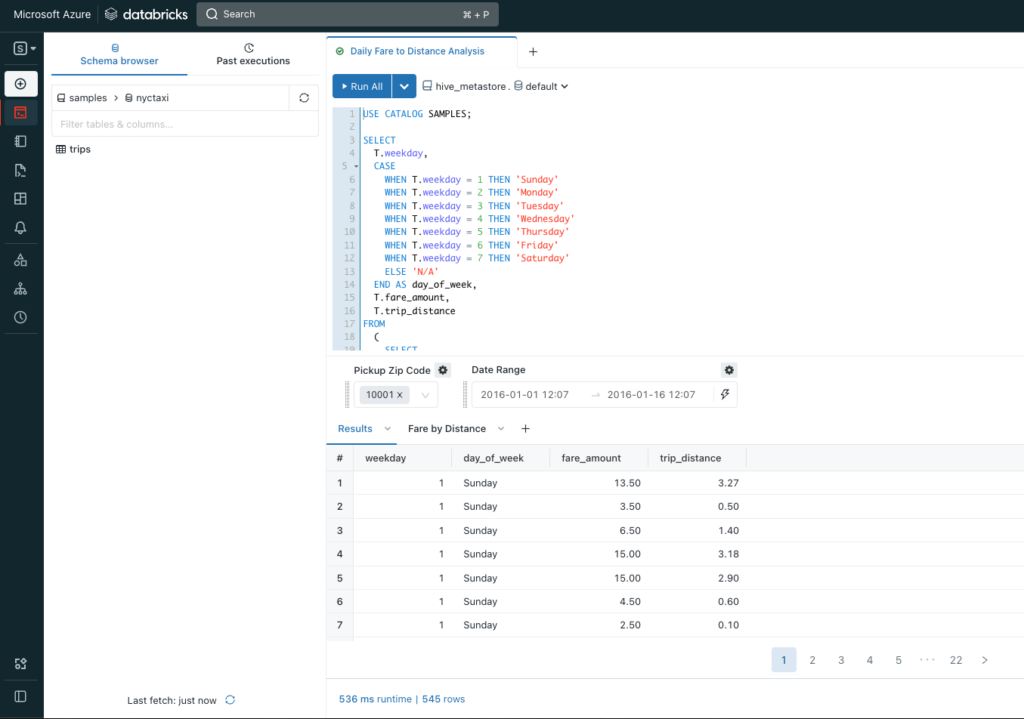
In this case, we’ll use the New York City Taxi data. Let’s look at the fare amount and trip distance by day of the week.
USE CATALOG SAMPLES;

SELECT
  T.weekday,
  CASE
    WHEN T.weekday = 1 THEN 'Sunday'
    WHEN T.weekday = 2 THEN 'Monday'
    WHEN T.weekday = 3 THEN 'Tuesday'
    WHEN T.weekday = 4 THEN 'Wednesday'
    WHEN T.weekday = 5 THEN 'Thursday'
    WHEN T.weekday = 6 THEN 'Friday'
    WHEN T.weekday = 7 THEN 'Saturday'
    ELSE 'N/A'
  END AS day_of_week,
  T.fare_amount,
  T.trip_distance
FROM
  (
    SELECT
      dayofweek(tpep_pickup_datetime) as weekday,
      *
    FROM
      `samples`.`nyctaxi`.`trips`
    WHERE
      (
        pickup_zip in ({{ pickupzip }})
        OR pickup_zip in (10018)
      )
      AND tpep_pickup_datetime BETWEEN TIMESTAMP '{{ pickup_date.start }}'
      AND TIMESTAMP '{{ pickup_date.end }}'
      AND trip_distance < 10
  ) T
ORDER BY
  T.weekday
I begin with a USE CATALOG statement like a USE <database name> in SQL server. Notice the object name delimiter is Databricks SQL is backtick instead of square brackets.
Also, notice that I can pass in parameters without setting up variables ahead of time. When I try to run this query, the Databricks interface will prompt for these values.

Even better, Databricks applies intelligence to the parameters. For pickup zip code, it looks at the available values and creates a multi-select drop-down list. The date range even gives me a date range and time selector!

Once you have results, you can click the plus button to the right of your results tab and click visualization to add a visual for your results.

You’re then prompted to select the visualization type and start assigning the columns to the different axes in your visualization. There are 21 visuals available as of this writing.

As you make selections, you get a preview of your visualization to the right. When you’re happy with the results, click save.

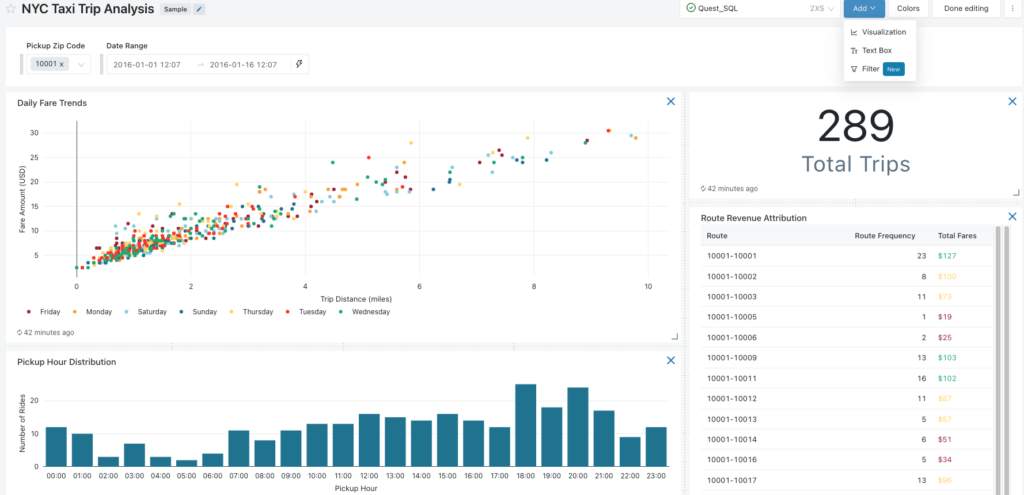
Once you’ve built a collection of visuals, you can combine them into a dashboard. Click the dashboards icon on the right, choose Create Dashboard, and add the visuals you want to combine. The parameters block at the top will automatically add the parameters needed to run the behind-the-scenes queries!

Conclusion
Getting started with Databricks as a BI developer is pretty easy. It won’t be long until you start to run into some limitations. The reporting and dashboarding work you do in Databricks is great for exploration but isn’t a great experience for collaboration and sharing with less technical folks. That’s why Databricks has partnered with PowerBI, Tableau, and others to extend this functionality. And if that’s still not enough, you can always create your visualizations through Python and its many visualization libraries!
These partners have already invested heavily in the BI and visualization space. That frees Databricks up to concentrate on the data processing engine itself.
In my next entry, we reach the end of our overview. I’ll share how to get started with Databricks on your own. Then I’ll go through how billing works. In the meantime, if you have any questions, please let me know.