Honestly, choosing which level to put this content under was one of the harder decisions I had to make when putting this content together. Before you get into this stuff, You need to understand queries pretty well. You should also have the fundamentals on what an index is, and how to manage them (add, alter, and drop). Let’s jump right in with the very basics of performance tuning.
How can you tell if a query needs to be tuned?
Pretty easy, right? How do you know if a query is performing poorly? At this point in your career, you’re pretty much depending on your users to complain about the performance of a certain query. Eventually we’re going to move you out of that. Look into products like Confio Ignite, redgate Monitor, or SQL Sentry Performance Advisor (I list them in alphabetical order, to try and show no favoritism) to start moving from reactive to proactive in performance monitoring. There are a few basic indicators you can use to evaluate the performance of a query. You can check the execution time, the execution plan (estimated or actual), and the page reads.
Execution Time

The first indicator you learn is execution time. As soon as you run your first query, you notice in the bottom right corner of your SSMS a time. In this example, it shows 00:00:00. Fast. The bigger that number is, the worse your query is performing, easy right? Not always. These numbers can be thrown off by locks or blocks. You know what those are, right? (If not, hit up google, I’ll write up articles on locking and blocking soon!)

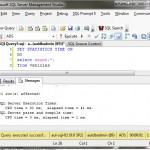
If you’d like to see this time appear where you can copy and save it, include the following before your query:
SET STATISTICS TIME ON
That will cause information about the time a query took to run in your messages tab when the query completes. While this number is volatile. I don’t suggest you ignore it, quite often it will be the indicator that is the deciding factor in choosing to put your time and energy into performance tuning that query.
Page Reads
One of the more useful statistics I use to determine if a query needs to be tuned is the IO STATISTICS. What this will show me is how much data did the server have to sort through in order to answer the query I sent it? When you add
SET STATISTICS IO ON
before your query, you’ll get extra information on your messages tab.
(1 row(s) affected)
Table 'Vehicles'. Scan count 1, logical reads 1006, physical reads 0, read-ahead reads 0
, lob logical reads 0, lob physical reads 0, lob read-ahead reads 0.
While all of these numbers can be useful, the one I use most often is the logical reads. This is the count of how many pages were read in memory to find the answer. The physical reads refers to how many pages were read from disks. The scan count is the number of passes through the index or heap it took to answer the query. The LOB statistics refer to Large Object data. This is data stored ouside the row ( such as VARCHAR(MAX), text, and XML data). The IO statistics can’t be taken alone. You need to look at other statistics, in the future, I’ll show you how you can also check the CPU usage of a query, for now, I want you to know it’s possible, but you should master these concepts first.
The Execution Plan

The last measurement I want to show you today is the execution plan. There are two execution plans you have access to from SSMS. The first is the Estimated Execution plan. I’ve heard Grant Fritchey suggest a better description than estimated…”a complete guess”. That’s really all it is. But if you have a query that takes two hours to run, you really don’t want to wait two hours to get the actual execution plan. That’s why we have both. In SSMS, you can choose either, and when you do, you’ll see an extra tab appear beside your results. This is how the server actually retrieved your results. There’s a ton of things I could tell you about execution plans…but for now, just know that it’s there, and you can use this tool to compare two queries. Simply write two versions of your query, highlight them both, then ask for the execution plan. You’ll see a relative cost to run each of the queries. If one query is far less than 50%, and one is far greater than 50%, you have a simple indicator that you have a better performing query. Soon, I’ll show you a lot more you can do with the execution plan in determining what needs to be tuned in your query. I’ll also share with you a review of SQL Sentry’s Plan Explorer. And I’ll cover why it’s better than the built in tools. In my next post, I want to cover query execution order. I had a question about this from a coworker recently, so I just had to share some information with you about it too! If you have any questions, send them in. I’m here to help!